In December, CUB released its latest edition of the annual Utility Performance Report. We already did a blog post summarizing some of the major findings in that report, but now we’d like to touch upon another area of the report that seems relevant given Gov. Whitmer’s recent State of the State address: the environmental impacts created by Michigan’s utilities when they produce energy, and how those impacts compare to utilities in the rest of the country.
This question of what kind of energy sources power Michigan came up in the State of the State address. One of the governor’s strategies to make the state’s economy more competitive is to “increase domestic clean energy production, like wind and solar, so we can produce more energy in America instead of overseas,” she said.
The 2022 Utility Performance Report includes data on how much electricity is generated from renewable energy sources for each utility around the country (compiled by the U.S. Energy Information Administration [EIA]). Michigan utilities generated 10% of their electricity from renewables in 2021, the most recent year with available data at the time the report was completed. That makes Michigan the 18th-lowest out of the 50 states plus DC for percentage of generation produced by renewable resources.
In addition, the rest of the state’s energy mix has been dirtier than average. In 2021, Michigan was one of 15 states where coal-fired power had the largest share of electricity generation of any source.
Burning coal emits more carbon dioxide, the greenhouse gas that most contributes to climate change, and more types of air pollution, like sulfur dioxide and nitrogen oxide, than almost any other type of electricity generation.
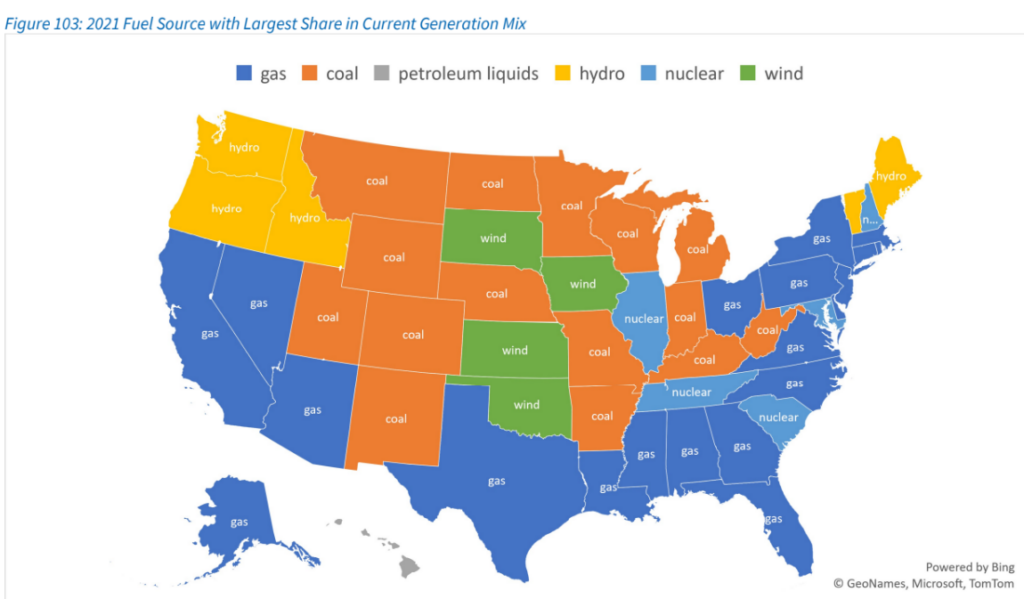
Michigan ranks among the states with the most metric tons of these emissions per GWh of electricity generated. When compared to other states in the Midwest, however, Michigan is average.
As found in our Utility Performance Report, here is how Michigan did on each of these types of emissions relative to the other 50 states and DC, along with a comparison to other Midwestern states (this data is from 2020 rather than 2021 due to timing of the data released by the EIA).
- CO2: 464 metric tons per GWh of electricity. That’s 16th-highest among the states, but lower than Indiana, North Dakota, Missouri, Ohio, Wisconsin and Nebraska
- SO2: 0.38 metric tons per GWh of electricity. That’s 12th-highest, behind Nebraska, Missouri, North Dakota and Ohio and roughly tied with Indiana
- NOx: 0.45 metric tons per GWh of electricity. That’s 14th-highest, behind North Dakota, Missouri, Indiana and Nebraska
But with DTE and Consumers Energy both setting retirement dates for their remaining coal-fired plants, we will see over the next decade or so if Michigan utilities can improve their standing when it comes to environmental protection.